AI systems are often black boxes. You put data in, results come out, and what happens in between is a mystery.
Shodh Memory includes something different: a Terminal User Interface (TUI) that lets you watch your AI's memory system in real-time. See memories form. Watch associations strengthen. Browse the knowledge graph. Explore indexed codebases.
Why a TUI?
Three reasons:
- Debugging: When the AI doesn't recall something you expect, you can see why. Is the memory stored? Is the association weak? Was it decayed?
- Understanding: Watching Hebbian strengthening in real-time builds intuition about how the system learns.
- Confidence: Seeing the memory system work builds trust in the system.
Plus, it looks cool.
The Main Dashboard
The dashboard is your command center for memory introspection:
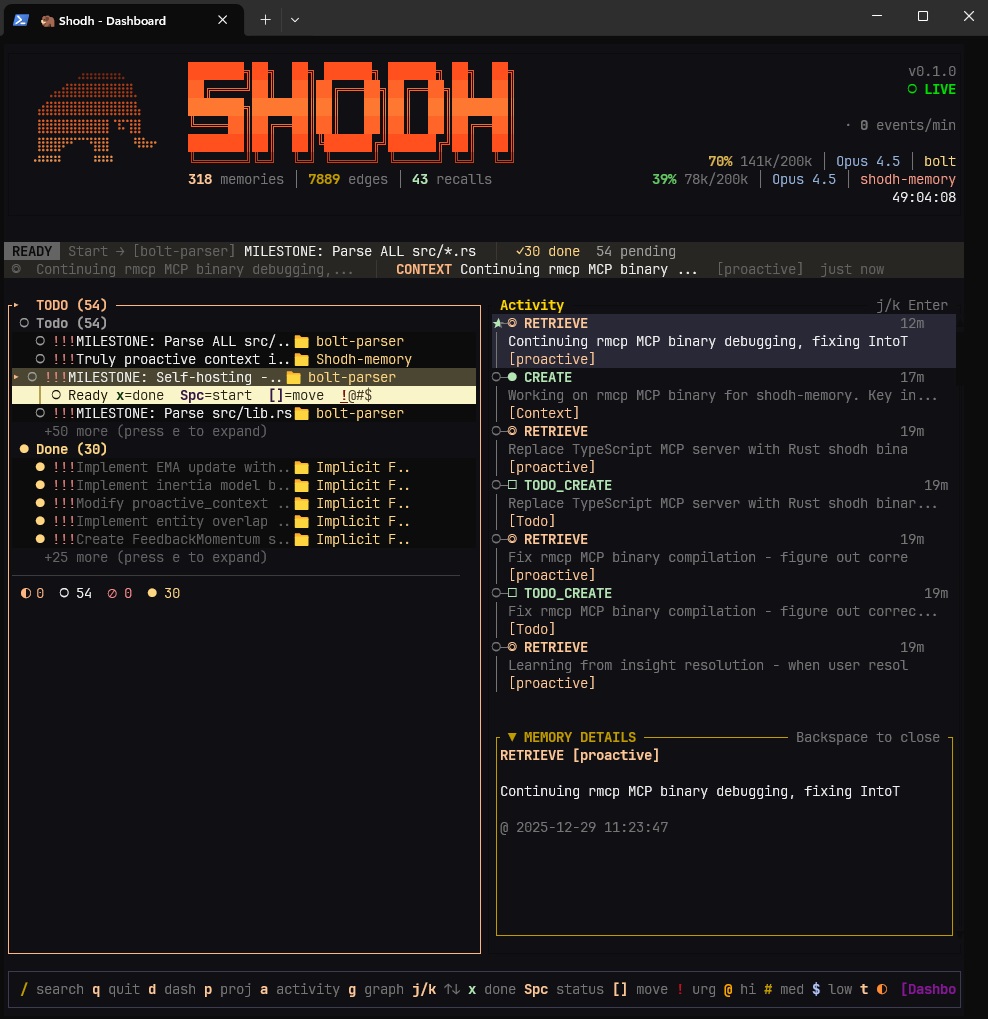
The dashboard shows:
- Memory List: All stored memories, grouped by type (Learning, Decision, Error, Context)
- Recent Activity: Real-time log of memory operations
- Stats: Quick metrics—total memories, edges, LTP connections, storage size
- Session Context: What's currently active across different users/sessions
Real-Time Activity Feed
Watch operations as they happen:
14:23:01  REMEMBER   "JWT refresh token implementation requires..."
14:23:01  EMBED      384-dim vector generated (47ms)
14:23:01  NER        Entities: [JWT, refresh token, implementation]
14:23:01  EDGE       New edge: jwt ↔ authentication (strength: 0.15)
14:23:01  EDGE       Strengthened: auth ↔ security (+0.12 → 0.67)
Hebbian Learning Visualization
When memories are retrieved together, their connection strengthens:
RECALL query: "authentication security"
  Retrieved: [JWT tokens, Session handling, Password hashing]

  Edge updates:
    jwt ↔ session:    0.45 → 0.52 (+0.07)
    jwt ↔ password:   0.23 → 0.31 (+0.08)

  Co-activation count: jwt↔session = 8 (LTP threshold: 10)
After enough co-activations, connections become permanent (Long-Term Potentiation).
Knowledge Graph Explorer
Navigate the association graph visually:
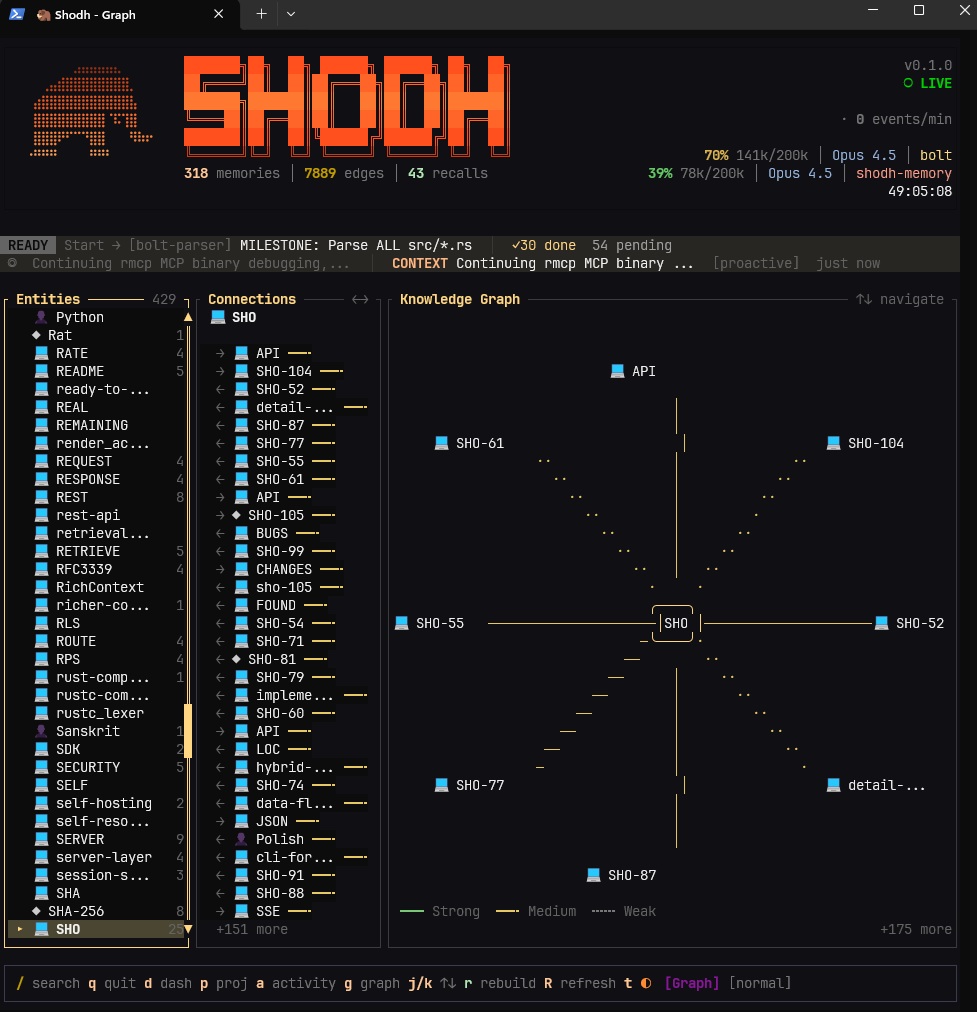
The graph view shows:
- Nodes: Entities and memory clusters
- Edges: Connections with strength indicated by thickness
- LTP Edges: Permanent connections highlighted
- Activation: Recently accessed nodes glow
Projects and Todos View
The TUI also provides a complete view of your task management:
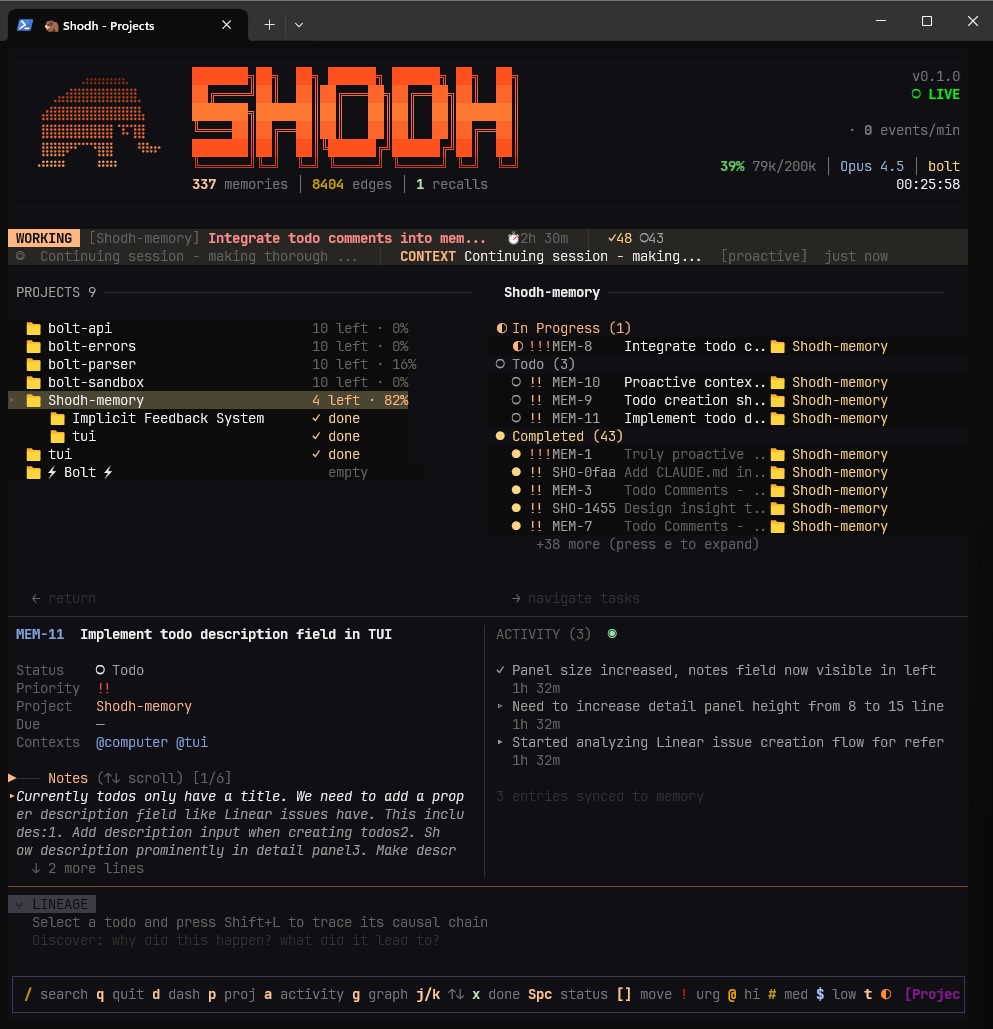
This view shows:
- Projects: Hierarchical project structure with sub-projects
- Todos: Tasks organized by status (backlog, todo, in_progress, done)
- Codebase Status: Which projects have indexed codebases
- File Browser: Navigate indexed files with related memories
Running the TUI
# Install the TUI binary
cargo install shodh-memory-tui

# Run it
shodh-tui

# Connect to a specific server
shodh-tui --server http://localhost:3030

# Watch a specific user's memories
shodh-tui --user claude-code
Keyboard Navigation
| Key | Action |
|---|---|
Tab | Switch panels |
j/k | Navigate up/down |
h/l | Navigate left/right (graph view) |
Enter | Select/expand |
/ | Search |
r | Refresh |
g | Go to graph view |
p | Go to projects view |
q | Back/quit |
Debugging with the TUI
"Why didn't Claude recall this memory?"
- Open the TUI, find the memory in the list
- Check its importance score (too low?)
- Check its last access time (decayed?)
- Check connected edges (weak associations?)
- Check entity overlap with query (no matching entities?)
"Why are these memories connected?"
- Open the knowledge graph view
- Find the edge between them
- Check activation count (how many times co-retrieved?)
- Check if LTP (permanent or temporary?)
The Value of Transparency
AI memory systems are only useful if you can trust them. Black-box storage that might or might not recall things correctly isn't helpful.
The TUI provides transparency: see exactly what's stored, watch learning happen in real-time, debug retrieval issues visually, understand the system's behavior.
This isn't just a debugging tool. It's a trust-building tool. When you can watch the AI's brain form connections, you understand why it behaves the way it does.